Segmenting customers into distinct groups of common characteristics is a critical step in deciding who to, how to, and what to market. A recent report from Campaign Monitor found that there was a 760% increase in email revenue from segmented campaigns. This huge uplift is because understanding the group (audience), their behaviors, preferences, and needs improves the likelihood of developing products, offers, and messaging that cuts-through communication noise and solves their problem.
Demand for leveraging data for accurate customer segmentation is growing in step with the speed and availability of data. Marketing teams across a broad range of industries look to leverage their growing data assets to develop strategies to attract, retain and delight customers. The challenge is that segmentation requires manual and labor-intensive steps that are prone to human error. Using machine learning (ML) for customer segmentation enables large amounts of data to be prepared, analyzed, and accurately segmented far more quickly. ML for customer segmentation offers an easier and faster workflow to begin targeting customers with marketing strategies sooner.
This use case details a machine-learning solution for customer segmentation using the AI & Analytics Engine.
Challenges of customer segmentation
Traditionally, customer segmentation is time-consuming taking months, and even years to prepare and analyze the vast and growing amounts of data and find patterns manually. It often requires various customer surveys, social media tracking, manual data analysis, etc. All of these are labor-intensive, time-consuming, and prone to human error.
Moreover, manually analyzing large datasets that are constantly updated requires a significant investment in money and time. Often, a team of data analysts or scientists who are skilled at preparing and analyzing data is needed to assist the marketing teams with the process of segmentation. This creates additional resourcing costs and can create bottlenecks or stymie marketing’s speed to market with new strategies.
Using machine learning for customer segmentation lifts this limitation, by analyzing customer data quickly to provide more accurate, data-driven customer-segmentation results while offering an easier and faster workflow overall. Thus, an increasing number of businesses are adopting machine-learning-based approaches to overcome these difficulties with customer segmentation.
The Solution: Machine-learning-driven customer segmentation
A machine learning method, called clustering, helps in addressing the difficulties mentioned above. It is a method that can ingest data that records characteristics of items, and generate groups of data items that are “similar”. For example, if an e-commerce website is interested in segmenting customers by their behavior, the clustering algorithm can ingest their behavioral data (number of clicks per item, login times, item categories being searched, etc.) and divide the users into groups with similar behavior.
Benefits of using machine learning for customer segmentation:
-
Automates the process of customer segmentation.
-
Handles large volumes of data.
-
More time effective than manual analysis.
-
Able to generate explainable results.
-
Requires minimal effort for analysis update.
Using a no-code platform for machine-learning tasks makes the process easier since it does not require analysts with coding skills and knowledge of machine-learning libraries.
How can the AI & Analytics Engine be used for customer segmentation?
The AI & Analytics Engine enables easy customer segmentation using its built-in clustering application.
For this use case, we will demonstrate it using the example use case of customer segmentation for an automotive company based on demographic features.
The company has 8,068 client records with the following features:
|
|
|
|
Gender
|
Gender of the customer
|
|
Ever_Married
|
Was the customer ever married
|
|
Age
|
Age of the customer
|
|
Graduated
|
Is the customer a graduate?
|
|
Profession
|
The profession of the customer
|
|
Work_Experience
|
Work experience in years
|
|
Spending_Score
|
Spending score ('low', 'medium', 'high') of a customer. The higher the spending score the more likely a customer is to spend more money on the company products and vice-versa.
|
|
Family_Size
|
Number of family members for the customer (including the customer)
|
|
Var_1
|
Anonymized category for the customer
|
After the data is uploaded to the platform, the following steps are performed:
-
Start a clustering application.
-
Select columns to be clustered (all of the above).
-
Select the clustering algorithm. (We just choose the default recommended method).
-
Run the process.
-
Analyse and export the results.
We will focus on step 5.
On the Engine, once a clustering algorithm has finished running on your dataset, you will have a clustering result page where you will be able to see the analysis of different clusters. For the dataset we considered, let us see what this analysis looks like.
According to the overview section of this analysis, we detected 6 clusters. We also managed to cluster more than 96% of the records, which is considered good.
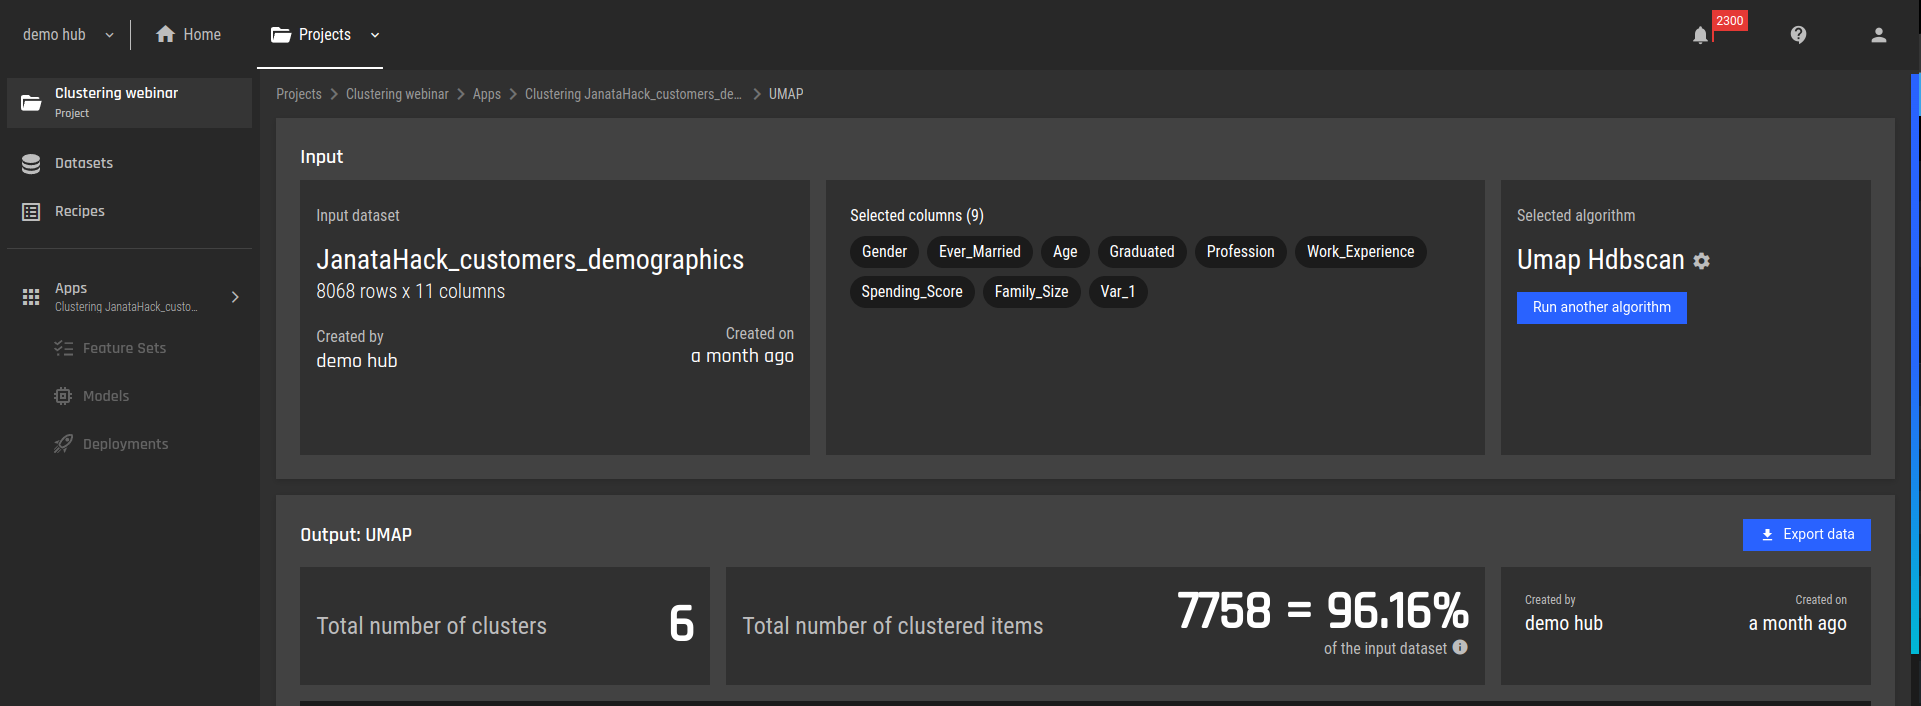 Fig 1 - Clustering results overview
We verify (visually) that the cluster shapes seem reasonable. This indicates the clustering worked as intended.
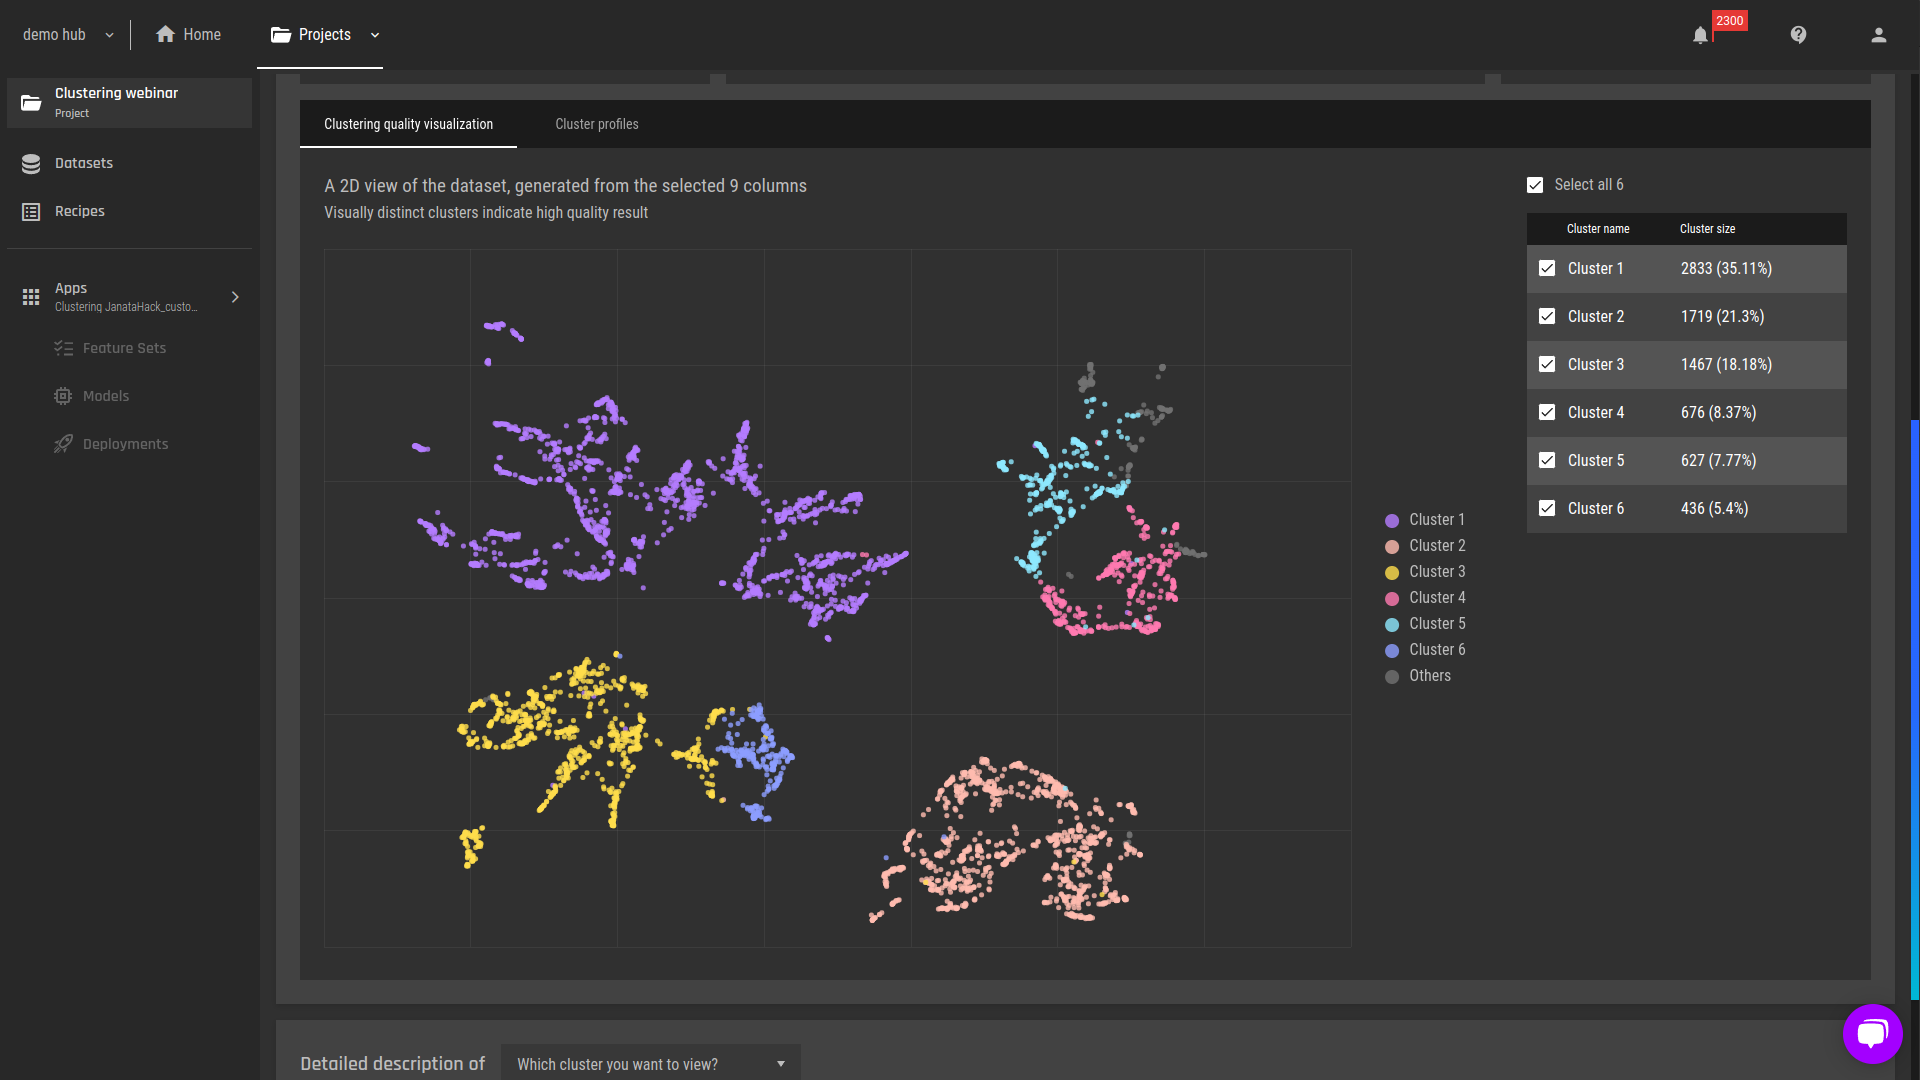 Fig 2 - A 2D (dimensionality reduction) view of the clusters
We proceed with a high-level analysis of the cluster characteristics:
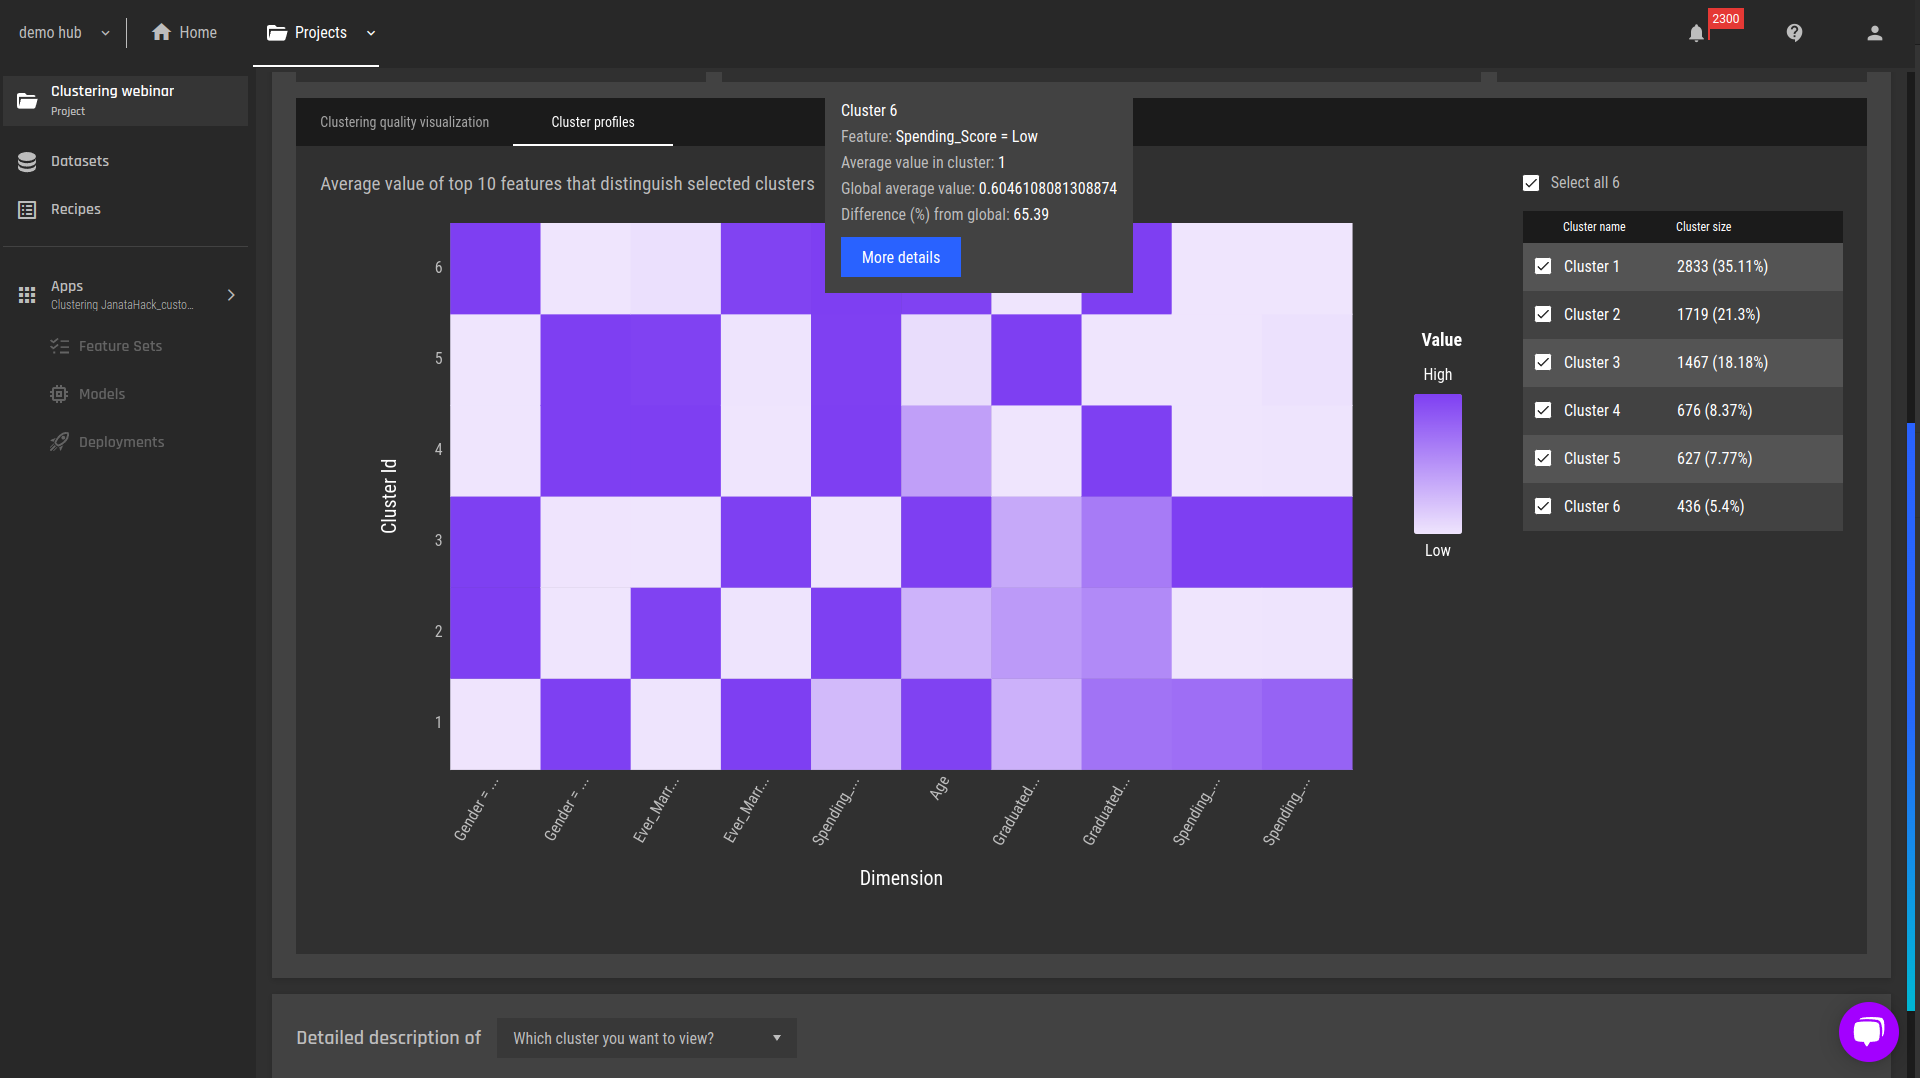 Fig 3 - Heatmap profiles of the clusters
Using the heatmap, we observe the "Spending_Score = Low column". We see that clusters 2,4,5 and 6 have relatively high proportions of low spenders. Hence, these will be the segments we’d like to target.
We can already identify the characteristics of these clusters using the heatmap, but an easier way to gain insights is by observing the detailed descriptions for the target clusters:
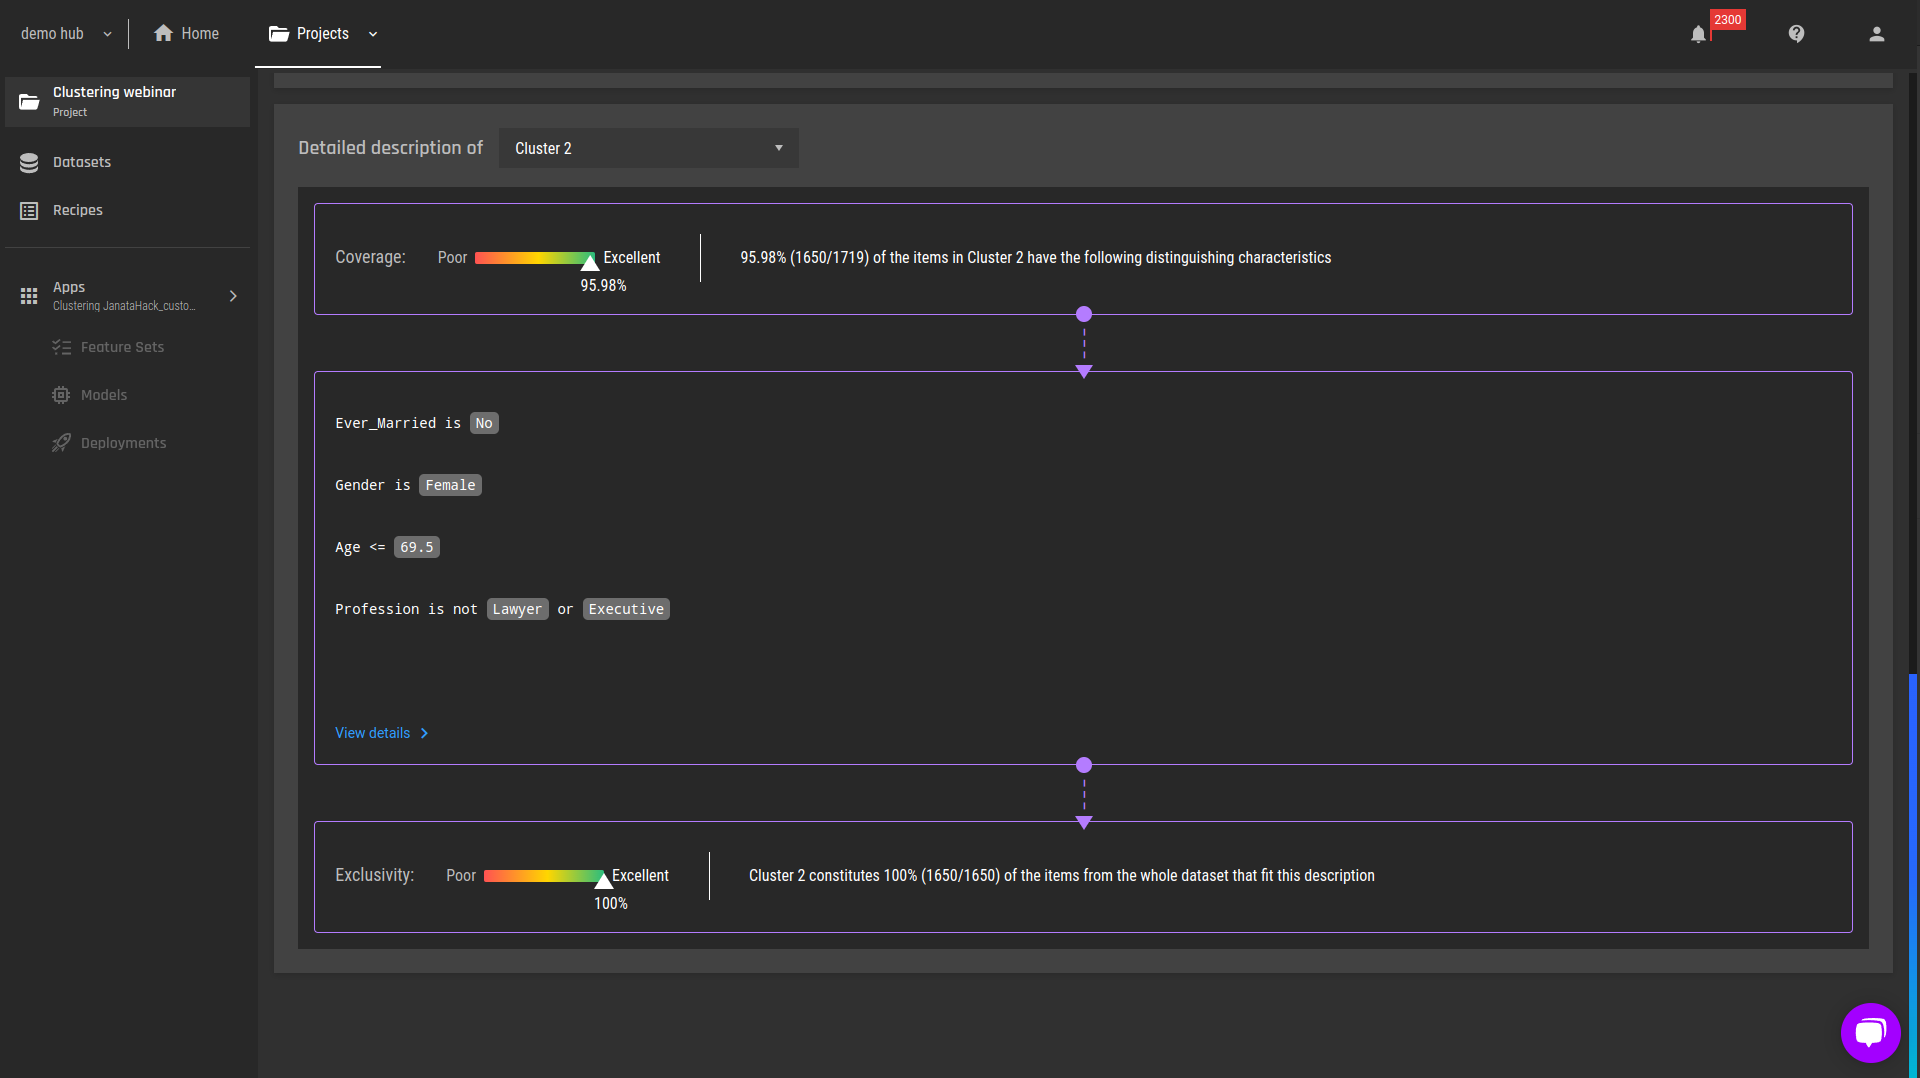 Figure 4 - Detailed explanations of cluster 2
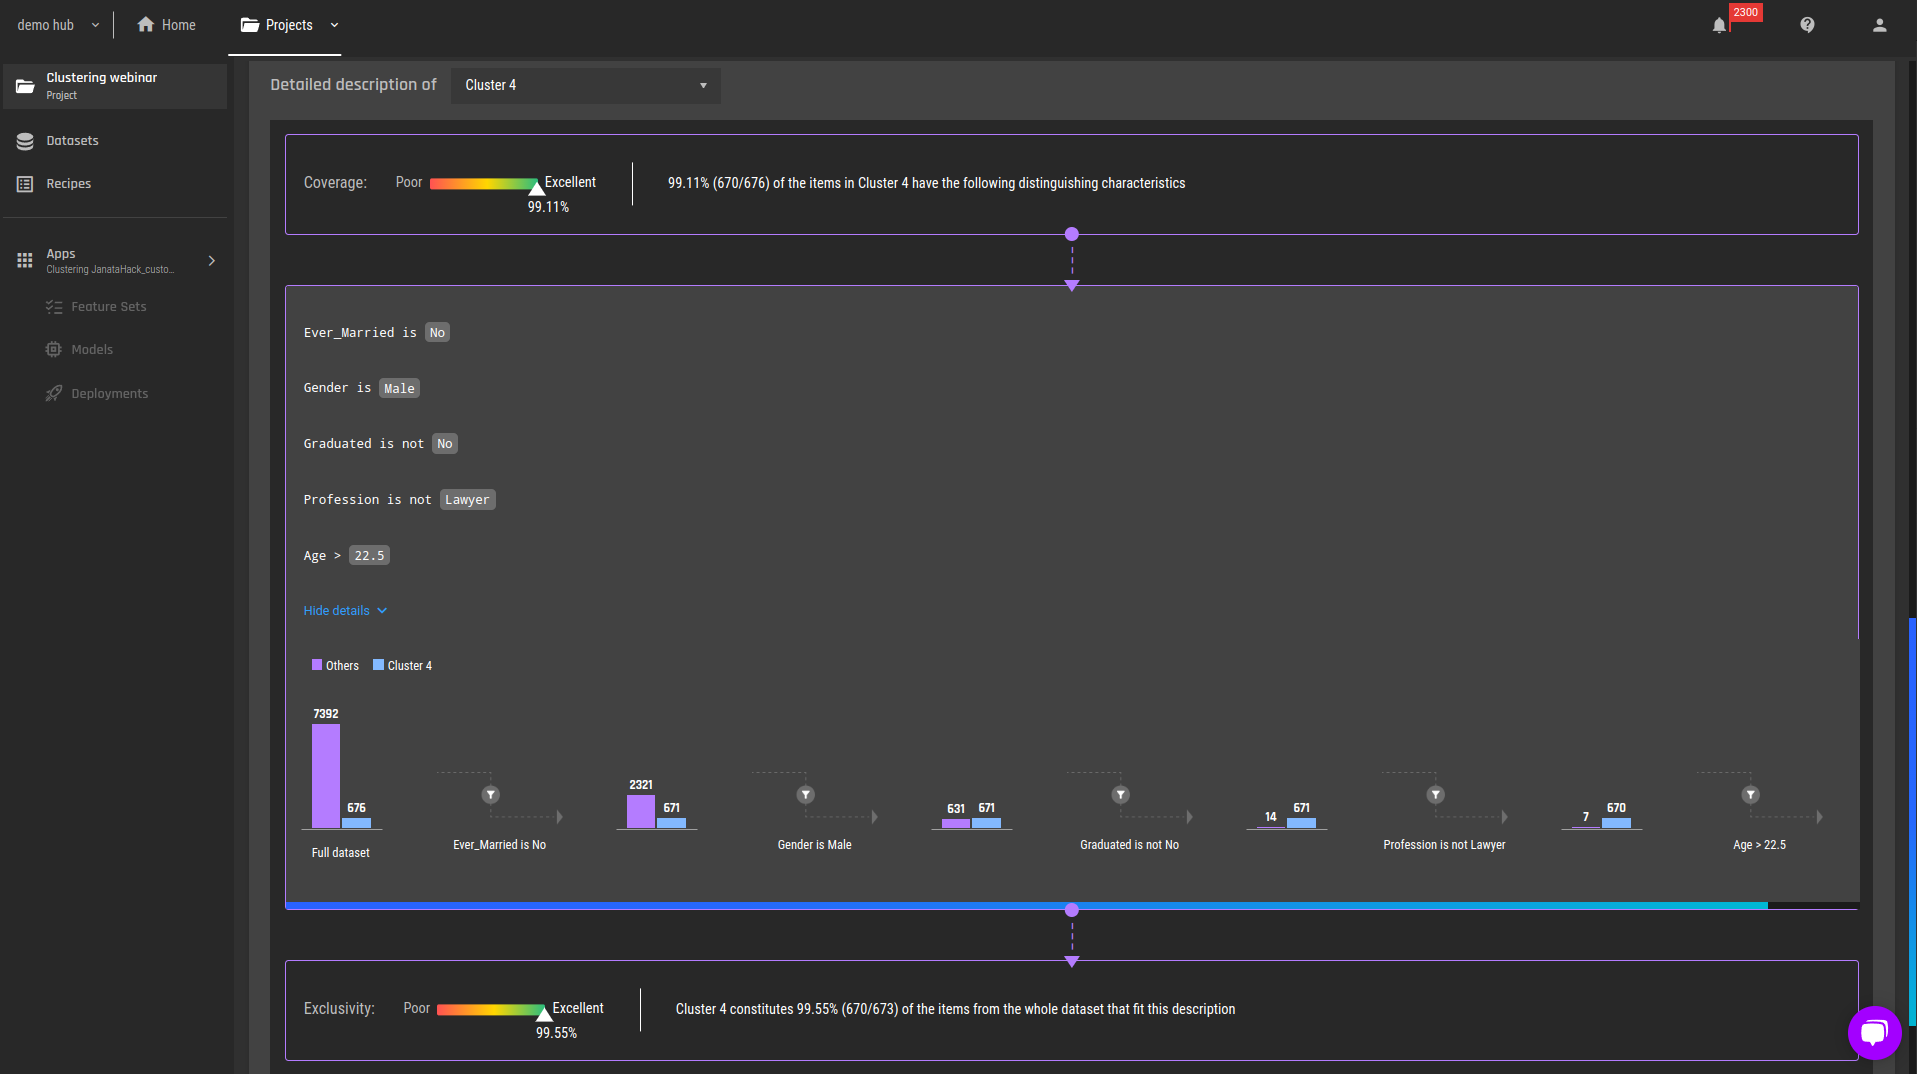 Figure 5 - Detailed explanations, cluster 4, with the full filtering details
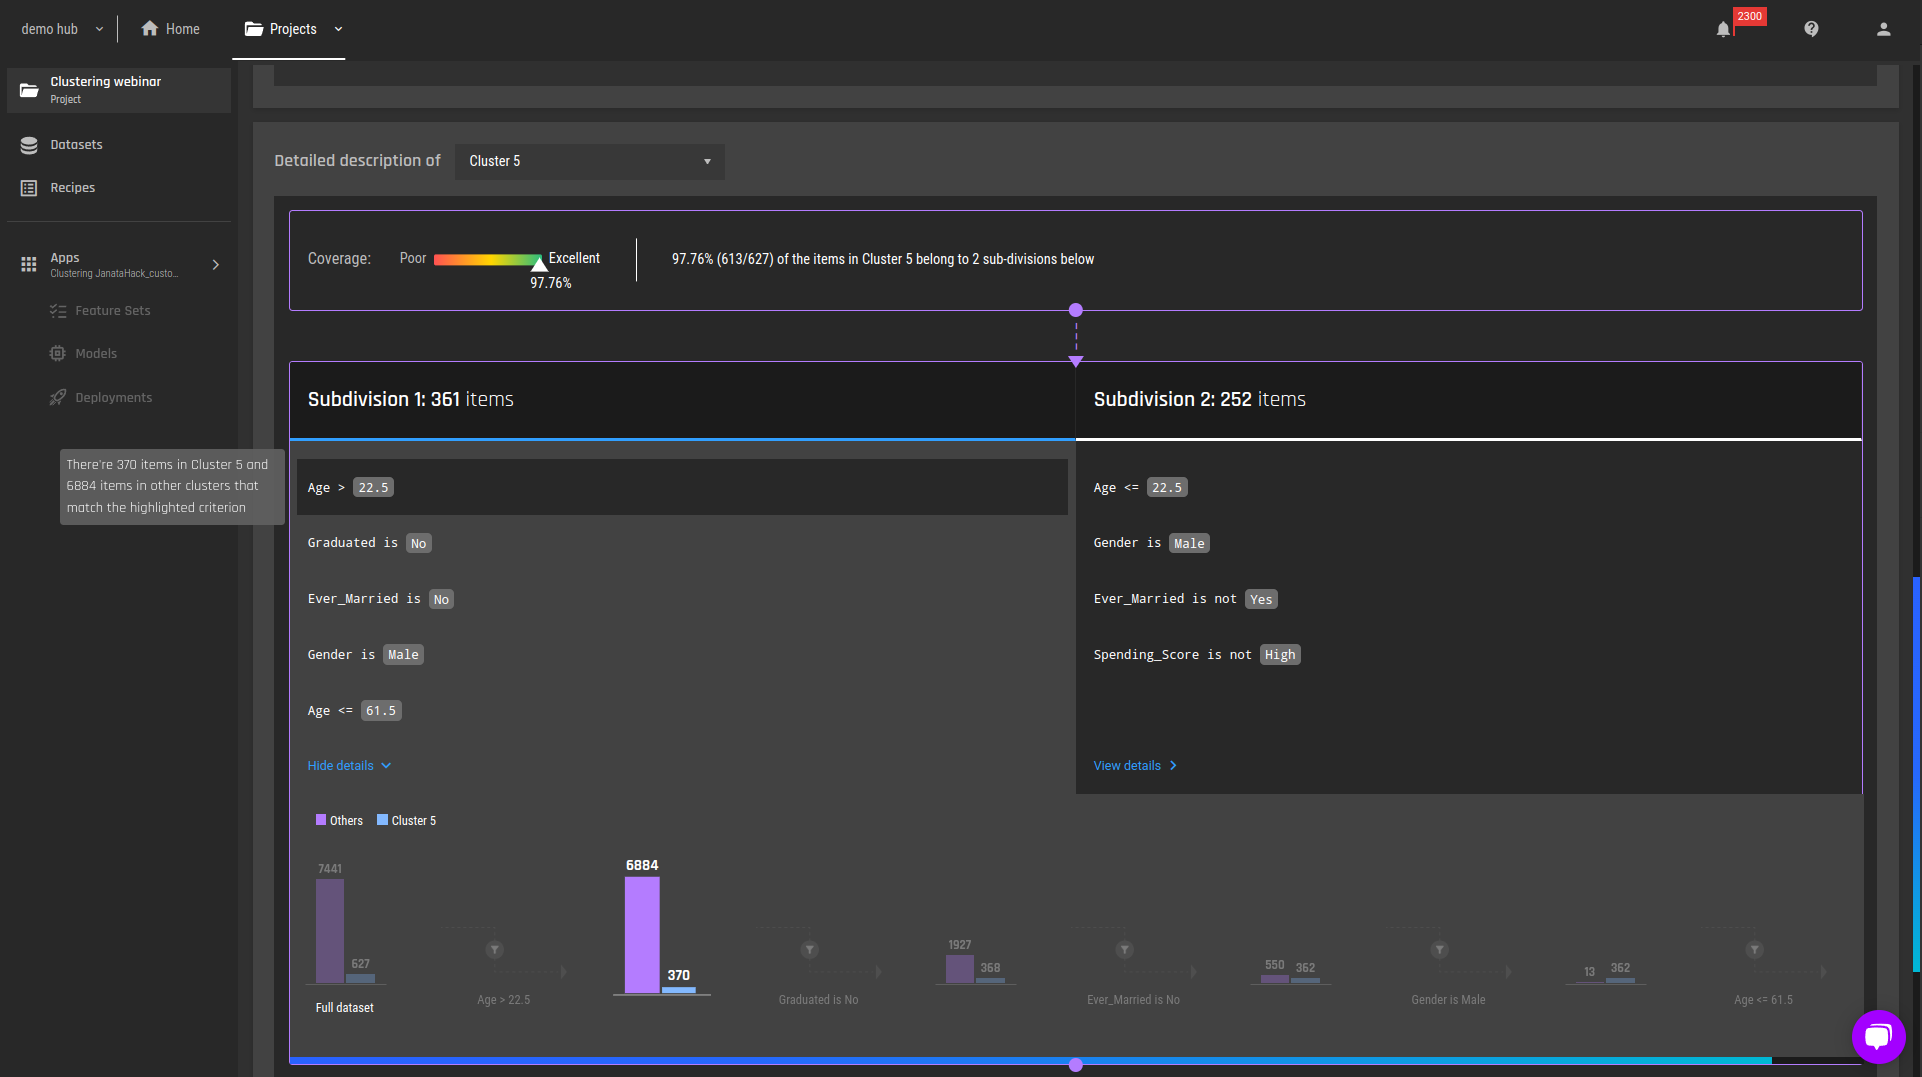 Figure 6 - Detailed explanations, cluster 5 with the full filtering details for the 1st subdivision
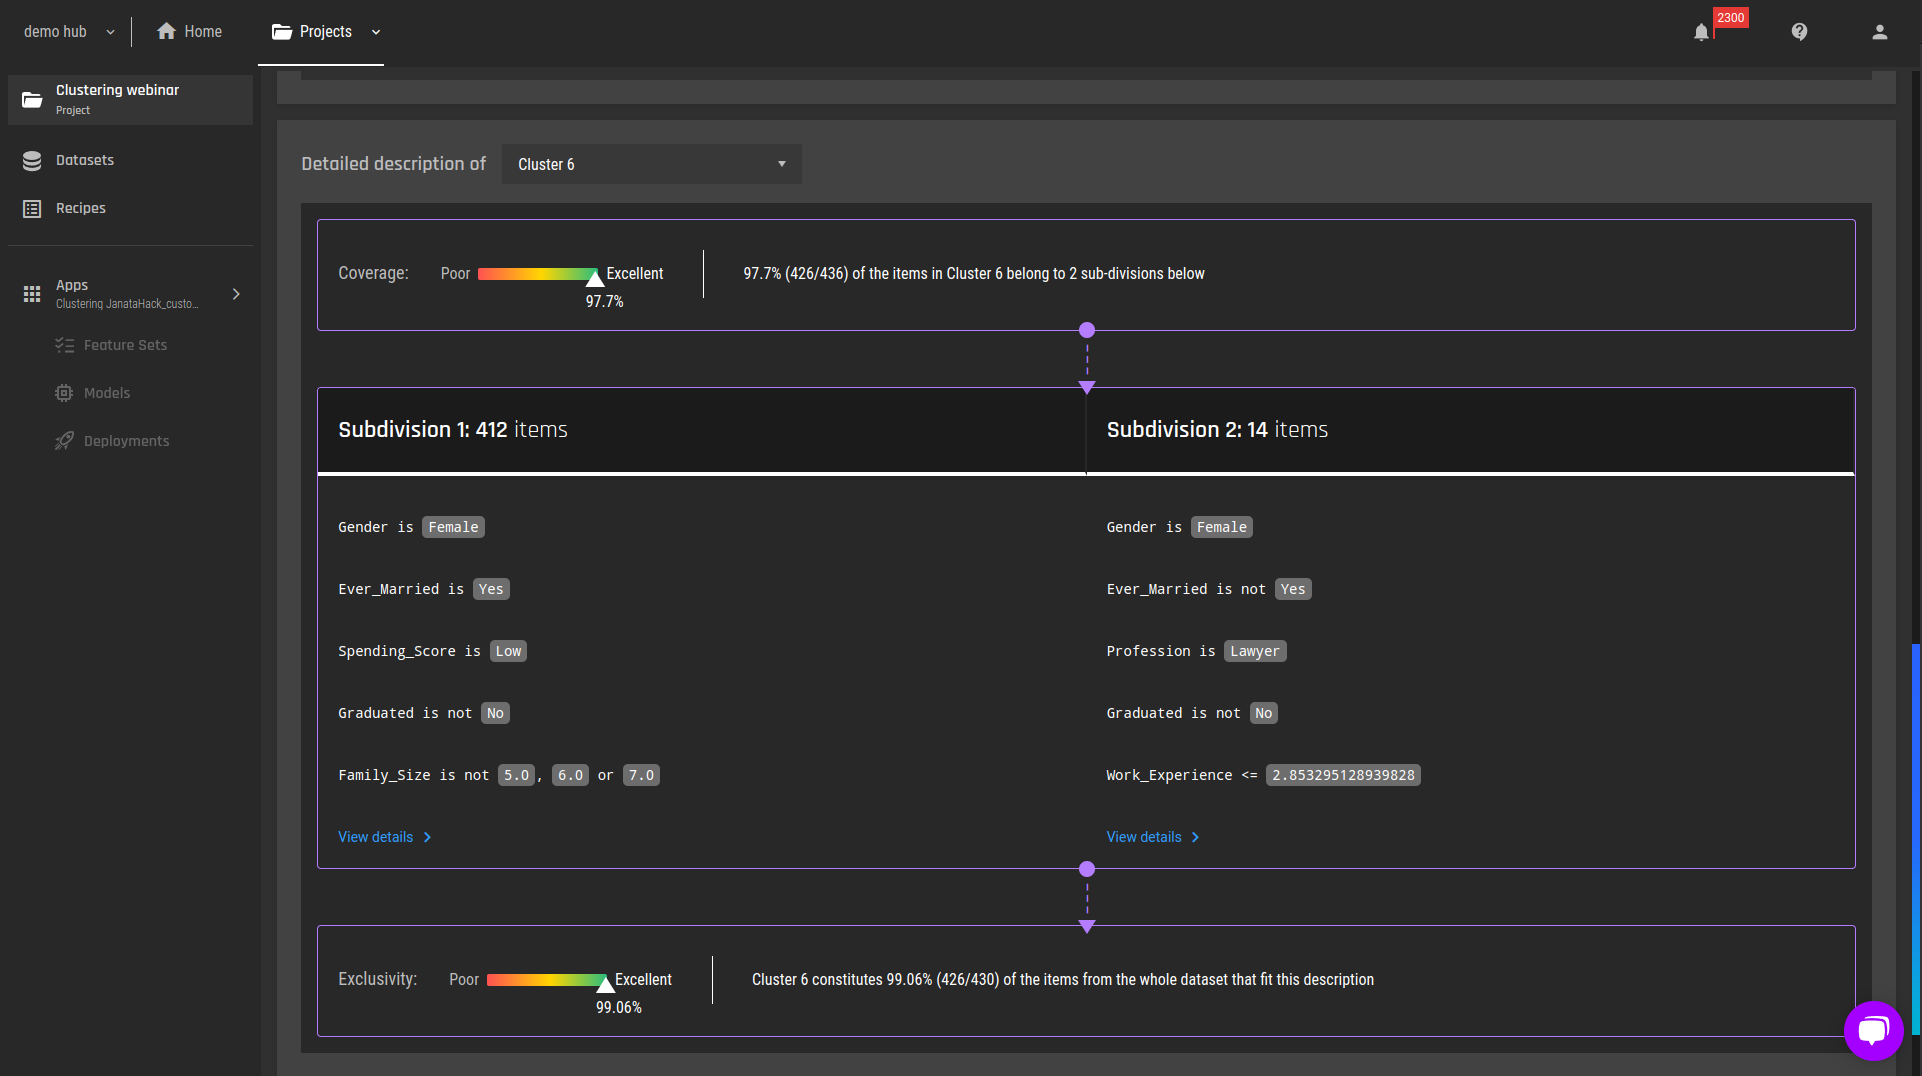 Figure 7 - Detailed explanations, cluster 6
From the descriptions above, we can broadly say that the characteristics of the clusters are:
-
Cluster 2: Single females, younger than 69.5 and not lawyers or executives.
-
Cluster 4: Single males, graduated, not lawyers and age > 22.5
-
Cluster 5:
-
Single males, not graduated, between the ages of 22.5 and 61.5, or
-
Single males, young (age < 22.5).
-
Cluster 6: Married females, graduated, with family size <= 4.
This information establishes a solid foundation for the marketing team to start a campaign. The last step is downloading the clustering results and filtering the client id’s that belong to the target clusters.
Industry Applications for Clustering
Clustering is a powerful machine-learning tool that can accelerate the customer segmentation process. Virtually, all industries already have existing data about their customers, and all industries would like to get a better understanding of their clients for business purposes. It is not surprising then, that customer segmentation is applied across many domains. Moreover, it is applied to many other use cases. For example:
-
Using sports statistics to match up players with similar capabilities for specific training sessions.
-
Clustering a large corpus of unlabeled documents. This can help us organise large volumes of text.
-
Clustering similar gene expressions in cancer studies.
Unfortunately, the devil is in the details, and the downside of clustering is the technical capabilities required in order to apply it and analyze the results.
This is where the AI & Analytics engine comes in and simplifies the work, by automating the flow and providing clear explanations of the results. To summarize, by simply using the data that businesses already have on their customers, they can build their own predictive model to start segmenting their customer base. All this is done on the AI & Analytics Engine, with zero coding necessary.
It’s time for you to start reaping the benefits of machine learning to know & target your customers better!