This article outlines the concept of prediction explanation.
Prediction explanation is an important tool on the AI & Analytics Engine, which helps users understand classification and regression models, and explain their predictions. This tool allows you to:
-
Sense-check the model by observing the model predictions for a random sample of several instances taken from the input dataset.
-
Explain how much each feature value of an individual instance sampled from the training data impacted the model’s prediction for that instance.
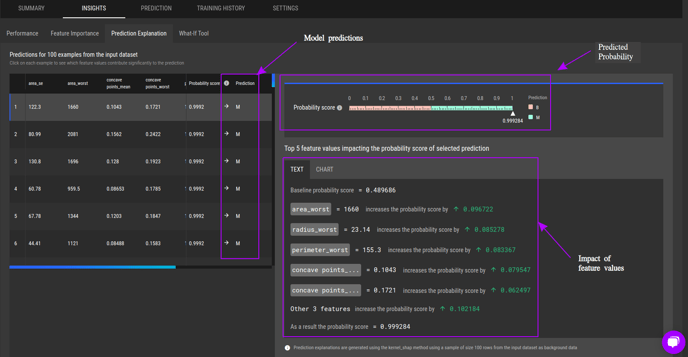
The example below shows the prediction explanation for a binary classification model developed for the Breast Cancer Wisconsin (Diagnostic) dataset.
-
The predictions for sample inputs can be seen in the “Prediction” column on the left side table.
-
The top right chart shows predicted probability for the selected input.
-
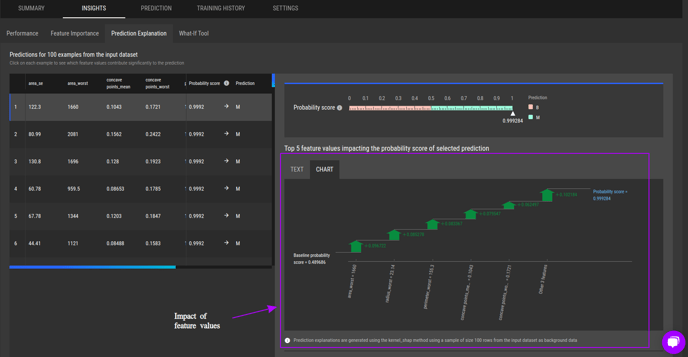
The impact of feature values on the prediction is shown at the bottom right, where user could toggle between text descriptions and chart visualization.

Prediction explanations for an example binary classification task

Prediction explanations for an example binary classification task (feature impact as a chart)
Kernal SHAP to calculate the feature impact
The impact of feature values of a selected sample on model’s prediction is generated using a method called Kernal SHAP (SHapley Additive exPlanation). Kernal SHAP calculates the contribution of each feature in a sample input on model’s prediction for that particular input, such that the prediction is equal to the total sum of contributions from features and the baseline prediction (see example above). This method takes into account both the individual feature contribution when in isolation as well as the contribution of that feature when it interacts with other features in the sample to ensure that the contributions are distributed fairly among the features.
