This article explores three tools offered by the AI & Analytics Engine for understanding your machine learning models: Feature Importance, Prediction Explanation, and What-If Analysis.
Feature Importance, Prediction Explanation, and What-If Analysis are tools that aim to provide insights into why models make certain predictions and how different inputs impact the outputs. Utilizing these tools allows you to assess model behavior, pinpoint influential features, and experiment with hypotheses concerning your models rapidly. Acquiring a deeper understanding of model predictions represents a crucial step toward developing more accurate, transparent, and reliable machine-learning applications.
You can access the mentioned tools under the Insights tab in the model detail page:
 The tools are located under the Insights tab of the model.
Feature Importance
The Feature Importance tool provides a quantitative way to rank the relevance of features and enables users to visualize the relative average contribution of each feature to the model's predictions.
The importance values are presented as percentages in descending order from the most influential to the least. Initially, only the top 5 most important features are shown. You can click Show all to reveal the full list of features and their importance scores.
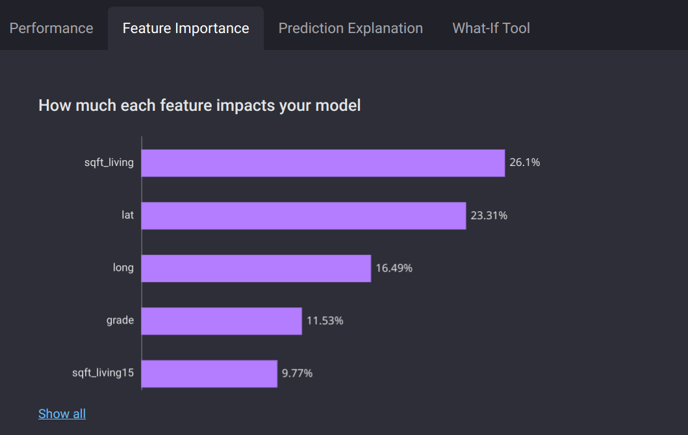 The top 5 most important features for predicting house prices. The living area (sqft_living) is the most important feature.
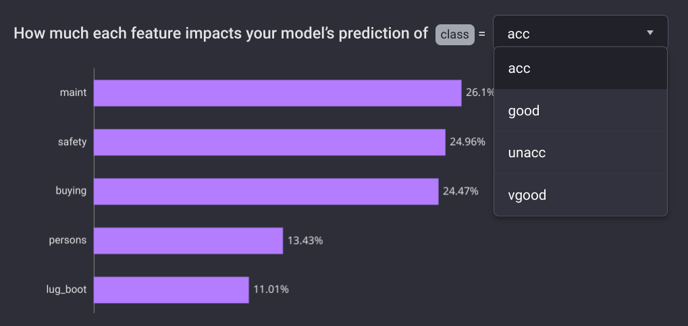
Feature importance for class acc.
Prediction Explanation
While Feature Importance enables a general understanding of the primary factors influencing the model outputs, Prediction Explanation offers a more comprehensive understanding of individual predictions by revealing the contribution of each feature to the prediction value (with respect to a baseline prediction) given a specific input combination of features.
![]() Baseline prediction is the result obtained by averaging all predictions. The explanation is only applicable to the specific input features provided during model training.
Baseline prediction is the result obtained by averaging all predictions. The explanation is only applicable to the specific input features provided during model training.
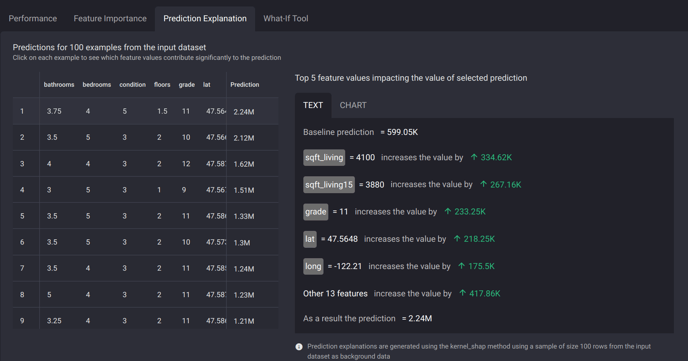
The figures above explain a house price prediction, with the predicted prices in dollars. Starting with a baseline prediction of $599.05K (the average of all predictions), we observe that a living area of 4100 sqft (sqft_living=4100) contributes an additional $334.62K to the baseline value. Additionally, considering the average living area of the nearest 15 neighboring houses, which amounts to 3880 sqft (sqft_living15=3880), further enhances the predicted price by $267.16K. After accounting for other contributions of the remaining features, the total predicted price amounts to $2.24M.
The prediction explanations provided are pre-computed for 100 sample instances from the training data. To obtain explanations for examples outside this pre-selected set, the What-If Analysis tool can be utilized, as will be demonstrated in the following section. Additionally, any of the 100 specific instances with pre-computed explanations can be copied directly into the What-If tool to enable further in-depth analysis.
What-if Analysis
What-if Analysis is a valuable tool that enables users to adjust input features and observe the resulting changes in model predictions. This capability facilitates a deeper understanding of how modifying inputs impacts outputs. The included prediction explanation also helps quantify the influence of adjusted features on the predicted values. Overall, What-if Analysis empowers users to thoroughly explore a model's behavior under various hypothetical scenarios.
For example, consider the input features given in the figure below:
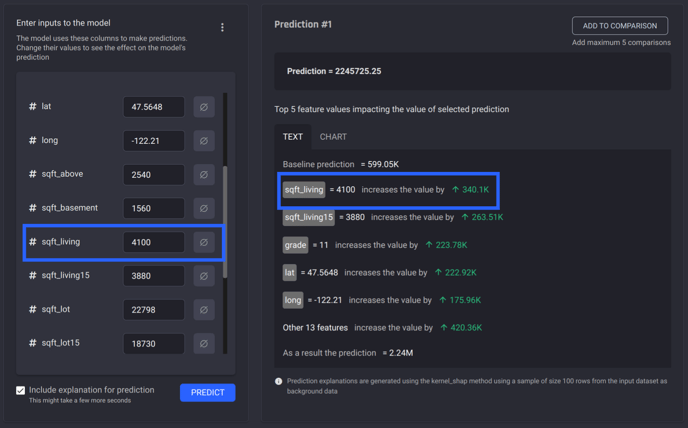 What-If tool interface. The left-hand side shows the pre-populated inputs. The prediction and explanation are shown on the right-hand side.
We knew from the previous sections that sqft_living is the feature that has the greatest influence on the predicted housing price. For this specific example, one may observe that the house's living area is 4100 sqft, exceeding the 3800 sqft average of its neighbors. What if sqft_living of this house is reduced 2100 sqft?
.png?width=688&height=428&name=Untitled%20design%20(6).png) sqft_living=4100 increases the price by $341.28K, whereas sqft_living=2100 decreases it by $88.16K.
sqft_living=4100 increases the price by $341.28K, whereas sqft_living=2100 decreases it by $88.16K.
From the figure above, having a less-than-average living area makes the price of the house go down by $88.16K.
To compare different predictions, users can click the Add to comparison button in the top-right corner to add up to 5 predictions for side-by-side analysis:
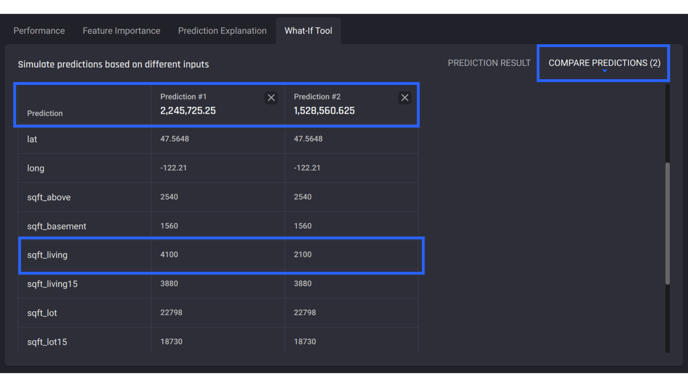 Compare the predictions side-by-side.
While What-If Analysis can be a useful exploratory tool, it should be used with care. In the example above, we modified the living area for a specific house and observed the resulting price reduction. However, there are a few important caveats to consider when using this tool:
-
The price reduction is only valid for the particular house we analyzed. We cannot conclude that "reducing sqft_living by 2,000 sqft results in an $88K price drop" for every house. In fact, it is difficult to predict exactly how much the price would change by adjusting living area alone, since price depends on many factors. We can only compare the relative influence of living area versus other features by examining the Feature importance.
-
The explanations are based on the trained model, so if the model was trained on a one-year-old dataset, and in the past year house prices have increased by 8%, the absolute contributions might be misleading because the estimated value of the same properties has changed, but the model is not aware of these changes.
