How Predictive Analytics is Driving Evolution in Insurance
The adoption of predictive analytics in the insurance industry is spearheading rapid evolution, leading to improved efficiency, and streamlined...
In the mid-late 2010s, Brad Stevens was a young up-and-coming coach in the NBA, defying expectations by navigating his spirited Celtics teams from rebuilding to contending far ahead of schedule. Those teams made me a die-hard fan of the Celtics and basketball. Today, he has moved up to General Manager of the Celtics, and I am still just as much of a fan of the team as I was 8 years ago.
In 2017, Brad Stevens said this:
"I don’t have the five positions anymore, it may be as simple as three positions now, where you’re either a ball-handler, a wing or a big"
If you’ve paid even a small amount of attention to the NBA in the last decade, you might have heard the phrase “positionless” basketball thrown around. The idea is that modern players are developing into versatile players who have skillsets that don’t align with traditional positions.
However, more often than not, the discussion starts and stops with the “eye test”. I wanted to dig deeper into the data around player positions, with some help from machine learning.
I’ll use historical offensive data from NBA players to train machine learning models that can predict the position of players from the '22-23 season and deliver insights:
Can machine learning predict modern players' positions?
Which player is the most positionless?
Does having positionless players help a team win games?
Keep reading, because I’m going to answer all these questions and more.
For the unaware, I’ll give a quick rundown of each of the five positions in basketball:
Point guard (PG): The PG is the primary ball handler due to their speed and directs the offense with passing.
Shooting guard (SG): The SG is a secondary ball handler, and a primary scoring either by creating their shot off the dribble or from a pass.
Small forward (SF): The SF is the most versatile position, with some ballhandling, playmaking, scoring and rebounding responsibilities.
Power forward (PF): Historically scores closer to the basket, by posting up or jump shooting from the midrange. Also gets rebounds off missed shots.
Center (C): The C historically shoots from close or midrange, rebounds the ball, sets screens, and rolls to the basket for an alley-oop.
A common example of modern players being more positionless is that shooting from 3pt range used to be done exclusively by PGs, SGs, and SFs, however, it’s becoming more and more common for PFs and Cs to do this as well.
The first step in any machine learning project is to collect two different datasets;
Training data: The training data is the data that the machine learning algorithms learn from. I gathered data on every single player from the ‘96-97 season to the '21-22 season (that’s 12,115 rows)
Testing data: The testing data is what I’ll be predicting which is players from the '22-23 season. This data must be in the same format, or schema, as the training data.
Predicting the position of the ‘22-23 players is a multiclass classification machine learning problem. Classification means predicting the class of something, in this case, the position PG, SG, SF, PF or C. Multiclass just means there are more than two options (in this case 5).
Class: The class is the first category of stat I recorded for each and every player in the training dataset, and this is where we come into the first issue - I had to rely on the notoriously inaccurate position estimates from Basketball Reference to teach the algorithms. I couldn’t find a workaround, and with no other choice, I proceeded with those.
Features: The features are all the other stats that are used to predict the class, with each of them having weaker or stronger correlations to each position. For example, high assists correlate to PG. I collected a total of 42 columns of shooting data and advanced stats from Basketball Reference.
I’ll go more in-depth into the exact stats that I used to train the models further down,
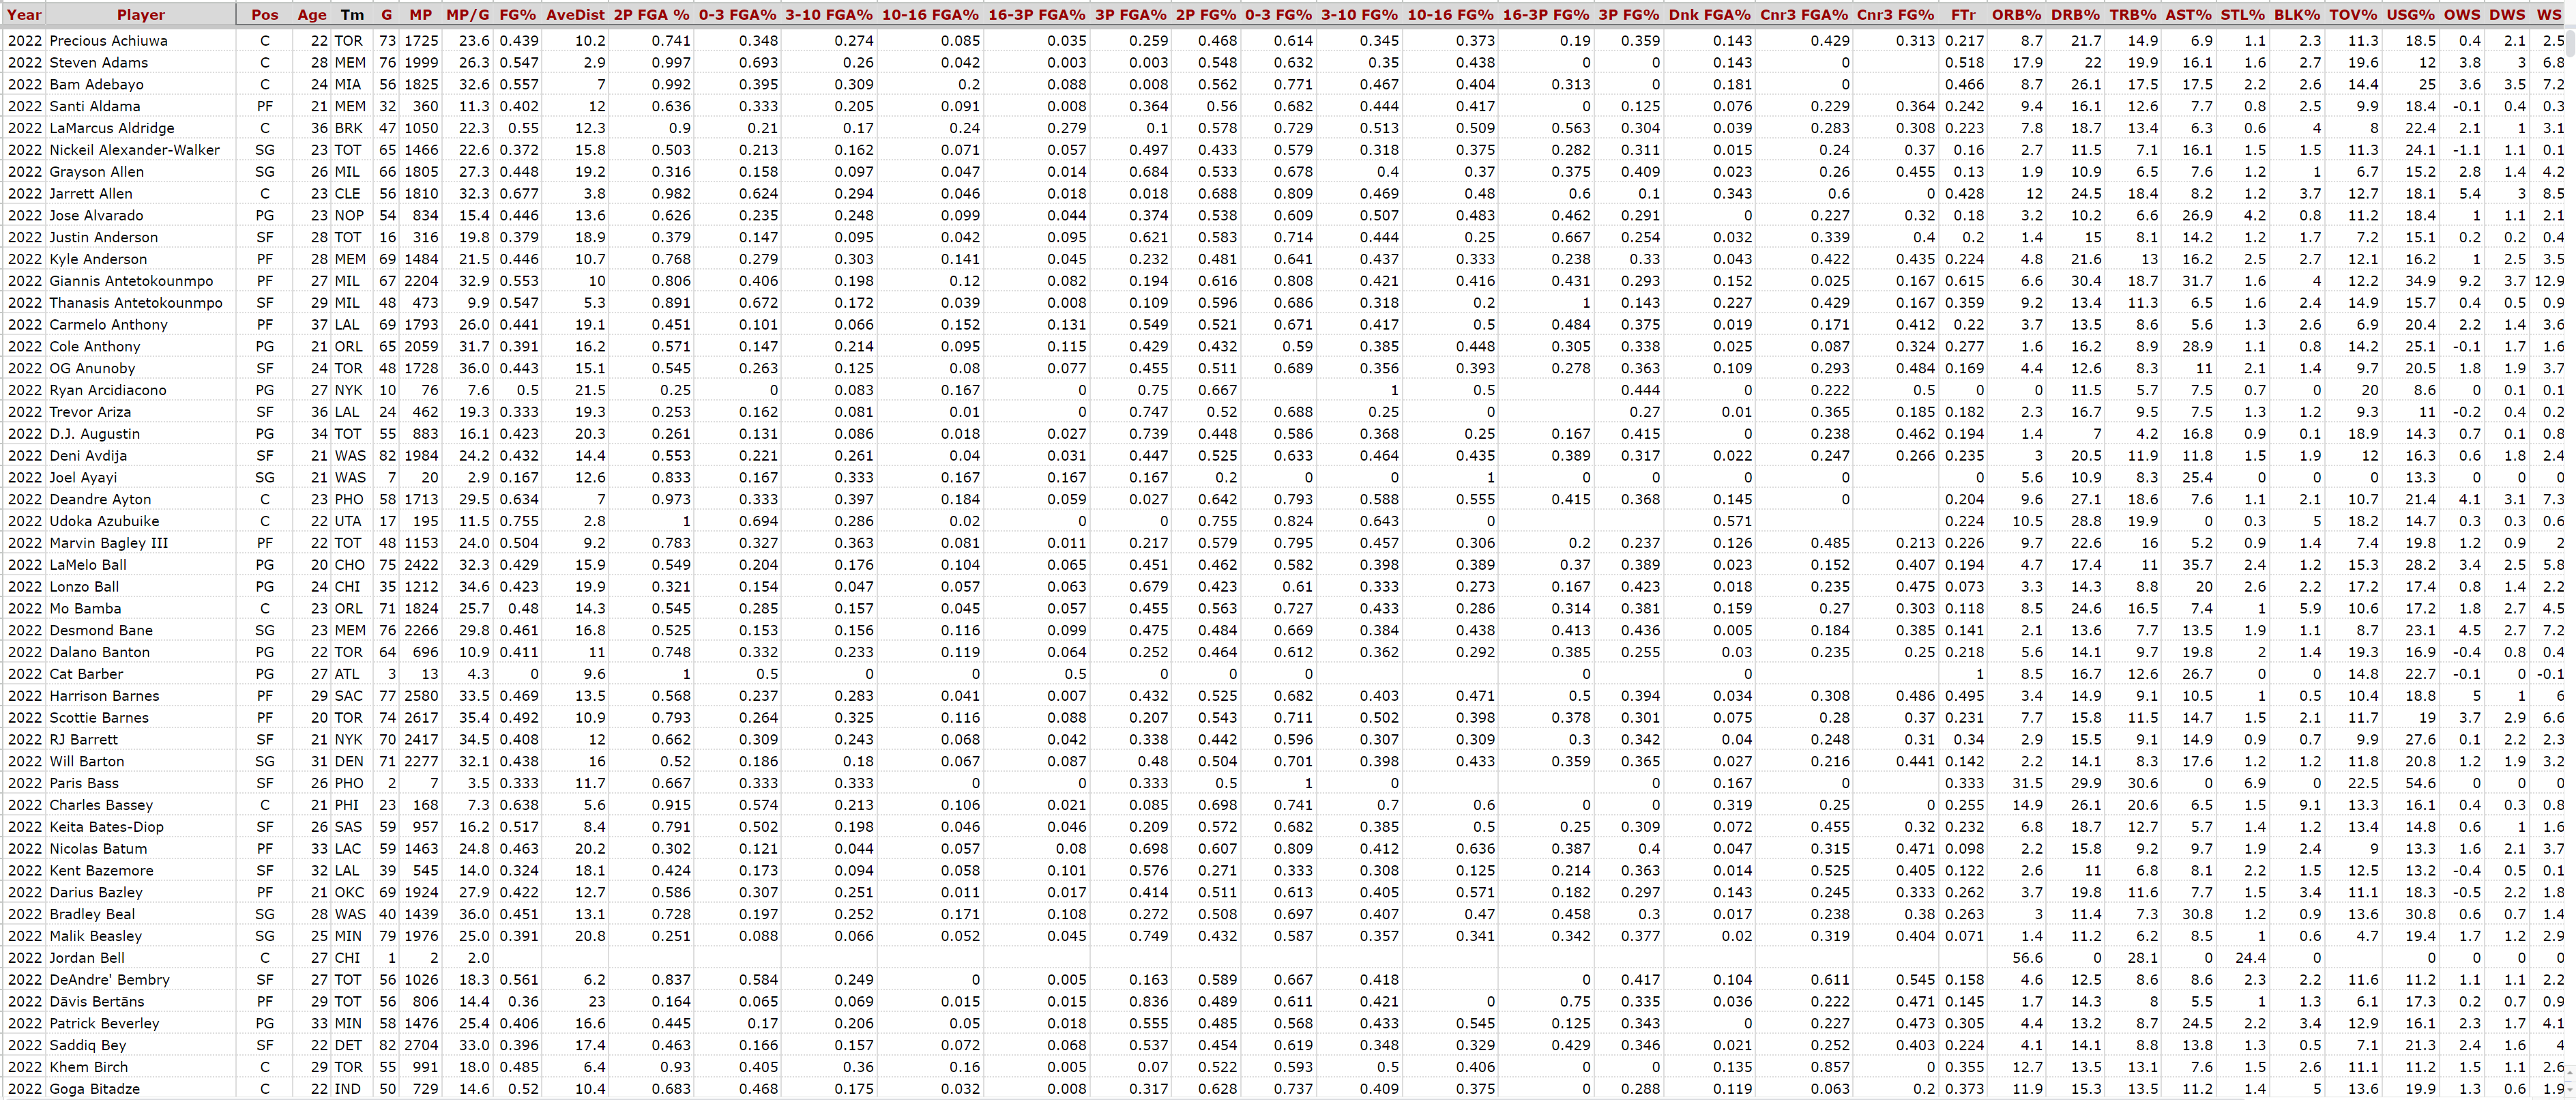 The dataset
I used the AI & Analytics Engine, which is a no-code machine learning platform, to quickly and easily clean the data and build the machine learning models.
Having collected the enormous dataset, I needed to prepare it for machine learning, a process called data wrangling.
I used the Engine’s data wrangling feature to fill in any blanks in the dataset with 0’s, and filtered columns to only keep the seasons that played more than 40 games, and more than 20 minutes per game, to remove weird outliers with a small sample size.
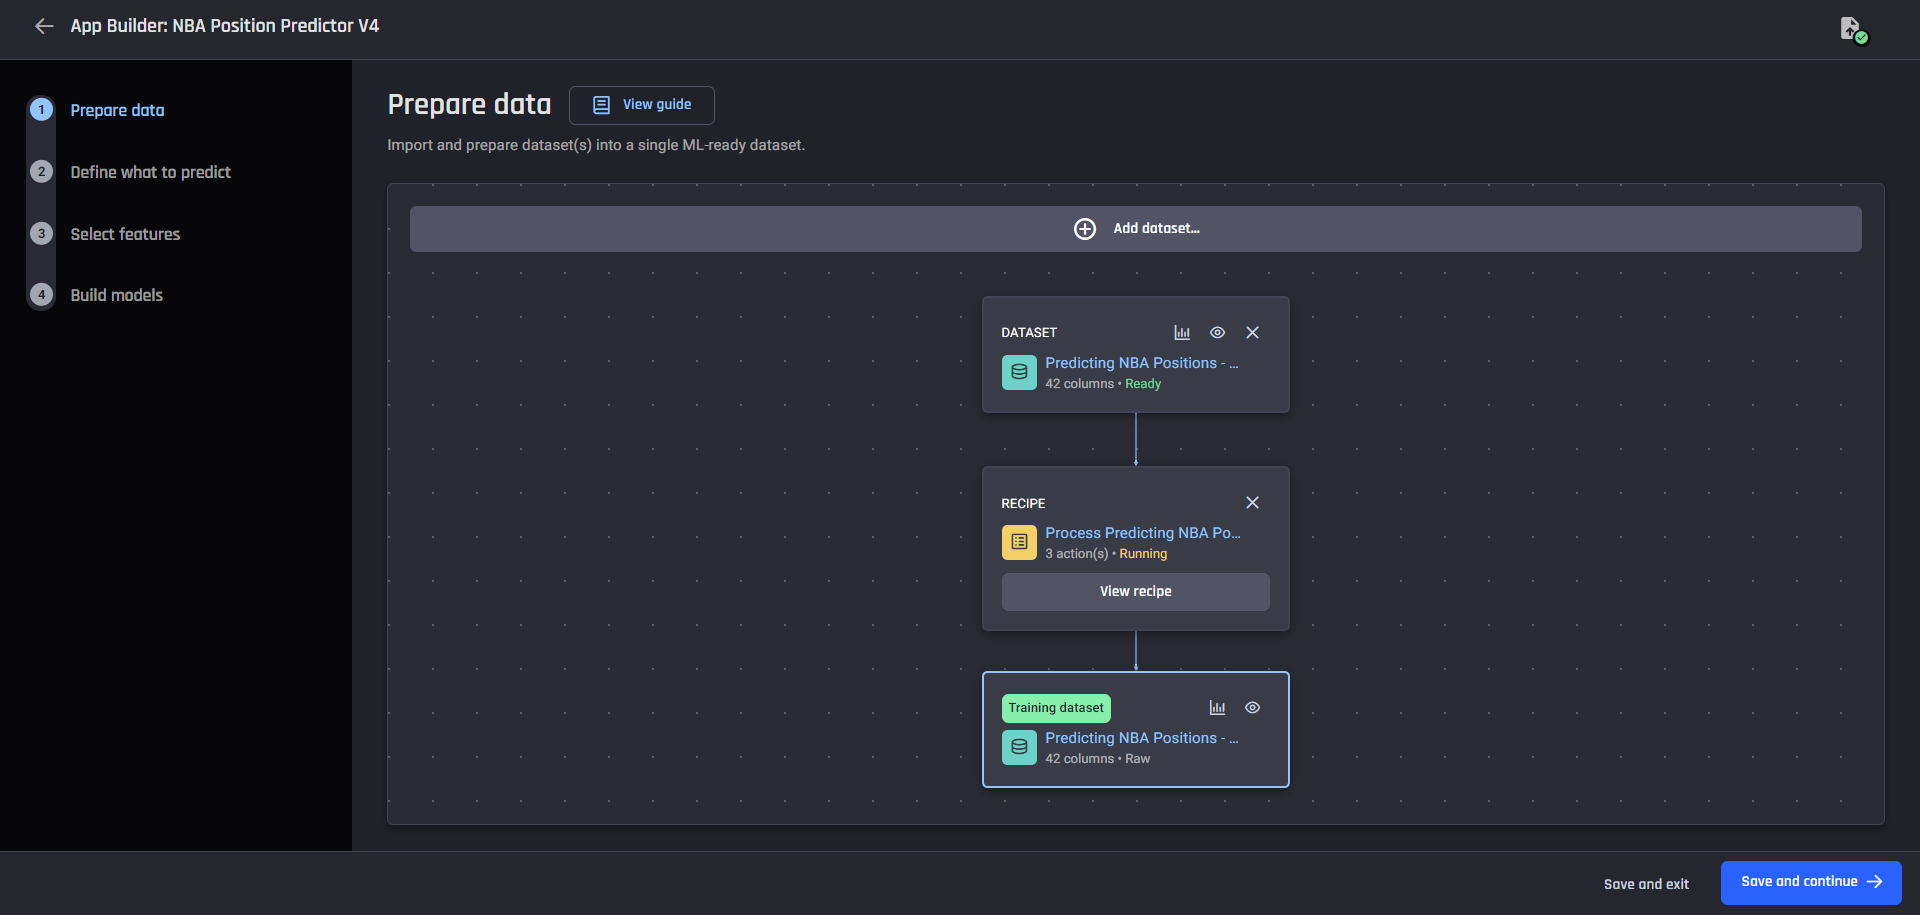 Data preparation pipeline with recipe
Remember those 42 features for each player from earlier? I went overboard collecting all of that data, there was no way I would ever need that many to train a decent enough ML model. Feature selection is the stage where I tell the model which stats to pay attention to when training the model.
I decided to only use offensive data. In an offensive position in basketball, there are only a handful of things a player can possibly do:
Make a shot
Miss a shot
Get fouled
Make an assist
Get an offensive rebound
Turn the ball over
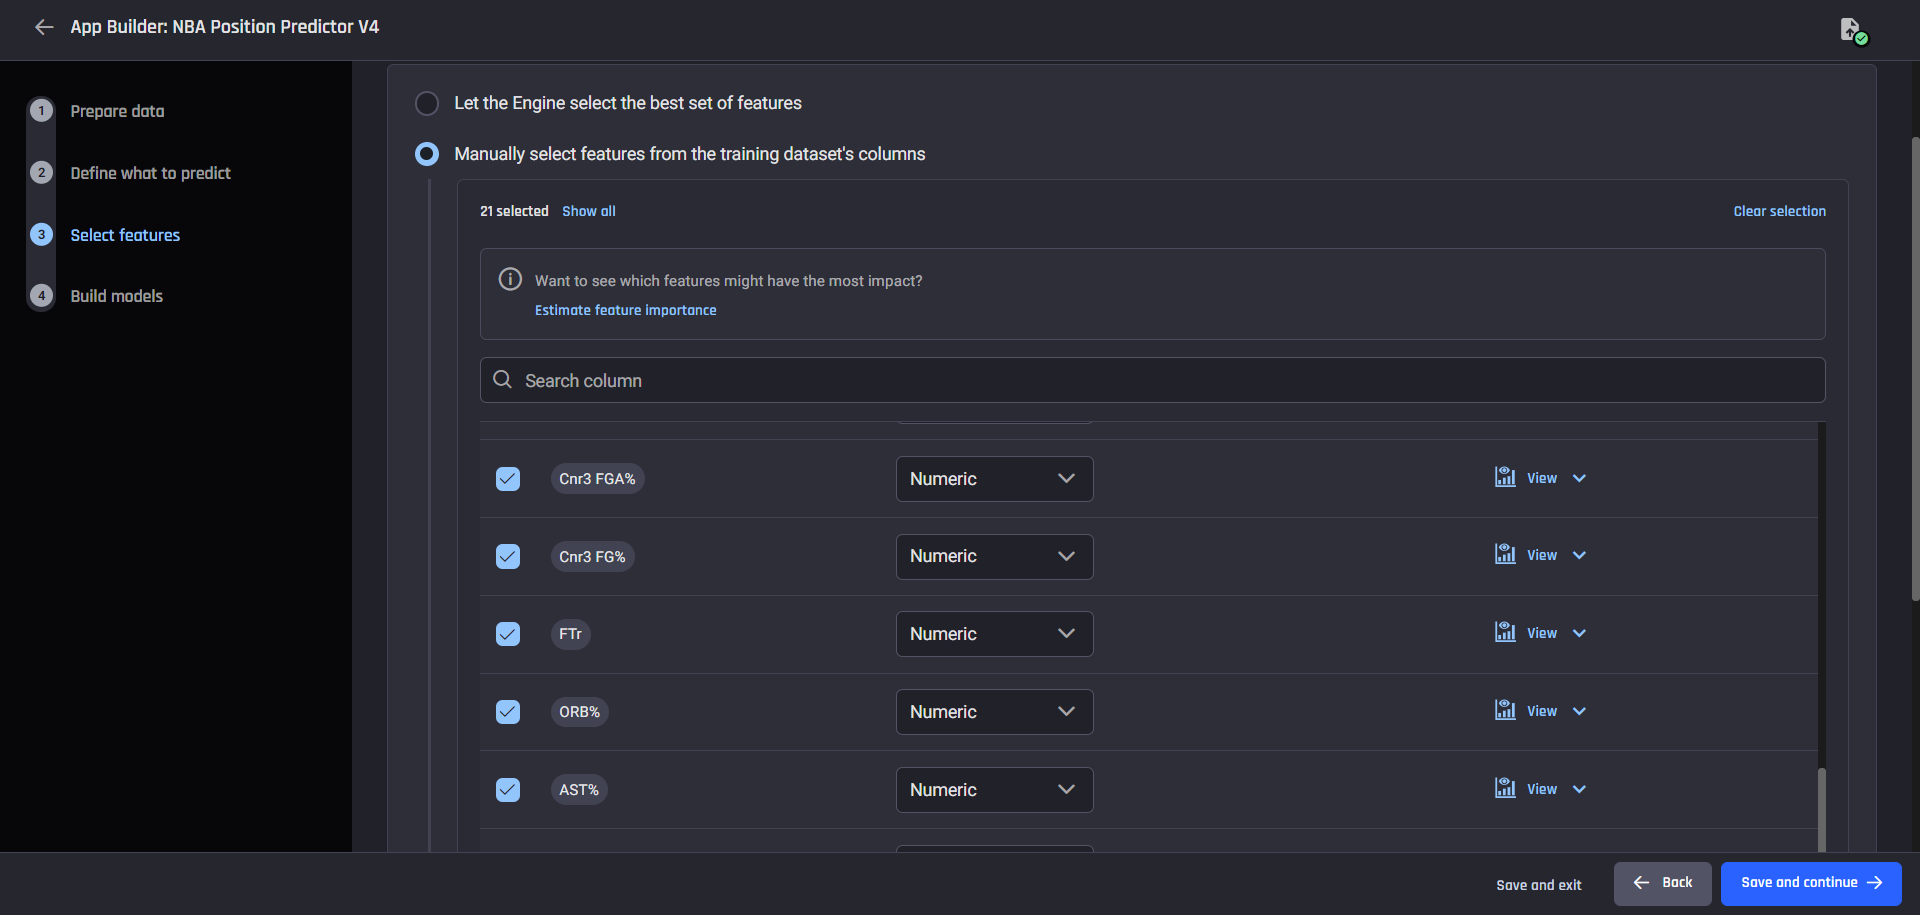 Feature selection
As such, I collected the following stats to try and cover the above.
Shooting stats by distance
By distance (For 0-3 ft, 3-10 ft, 10-16 ft, 16ft-3P, 2P, 3P)
{distance}FGA%: How often do they shoot from {distance}
{distance}FG%: How accurate are they from {distance}
AveDist: Average distance of shots
Shooting stats by shot type
Dnk FGA%: How often do they dunk
Cnr 3PA%: How often do they shoot 3’s from the corner
Cnr 3P%: How accurate are they from the Corner 3
Advanced metrics
FTr: How often are they fouled while shooting (free throws)
ORB%: How often do they get an offensive rebound
AST%: How many of teammates shots do they assist on
TOV%: How many turnovers do they make
I used the Engine to train two models, which use the following classification algorithms:
Random Forrest Classifier
XGBoost (extreme gradient boosted)
How these algorithms work under the hood isn’t so important, so we don’t need to delve deeper here. All you need to know is, their approach to predicting a class is slightly different and they arrive at different predictions.
With both models trained and ready to go, I made predictions for the 172 players from the '22-23 season who played over 40 games and greater than 24 minutes per game. I averaged the probabilities given from each model, and the results were:

The models predicted 108/172 (63%) correctly (at least according to the listed position from Basketball Reference). From here, I calculated how the models performed for each position.
Precision and recall are metrics used to evaluate machine learning model performance. Precision can be thought of as “How many of the true PG players did the models get correct?” whereas recall is “Of all the predictions made for PG, how many were true?” I’ll explain the difference with an example.
Let’s look at SG. There were 38 true SGs, and it predicted 28 of them correctly, the precision metric is 73.7%, which is pretty good. But then you realize that the model made 52 SG predictions (way more than any other position), resulting in a recall of only 53.8%.

So what insights can we gain from these results? Firstly, the models performed best at predicting Cs, where high rebounding and low average distance were strong indicators. The model was also quite good at predicting PGs, where high assists were a strong indicator.
However, we can see that the models can have greater trouble distinguishing wing positions SGs, SFs, and PFs from one another. We knew from the start that players at these positions tend to be versatile and can do a little bit of everything, which is why the models struggle to predict them with as much accuracy.
To find the most positionless player, I created a metric that measures how equally distributed a player's predicted position is. First, I calculated the variance of a player's positional probabilities, and used that to invent my “positionless” metric I, which I call POSL%:
POSL% = (1- 2.3 x Var^0.5175) x 100
This formula scores players from 0-100%, on how equally the players predicted positions are. With my brand new metric in hand, these are my rankings for the league's most positionless players:
Jayson Tatum (86.37 POSL%)
Markelle Fultz (85.74%)
Jordan Clarkson (85.42%)
De’Aaron Fox (85.42%)
Ben Simmons (82.54%)
Draymond Green (82.31%)
Kevin Porter Jr. (81.16%)
Jalen Suggs (80.46%)
Shai Gilgeous-Alexander (78.89%)
P.J. Tucker (78.36%)
Pascal Siakam (78.18%)
Kyle Anderson (78.15%)
Jaylen Brown (77.57%)
Josh Giddey (76.22%)
DeMar DeRozan (76.18%)
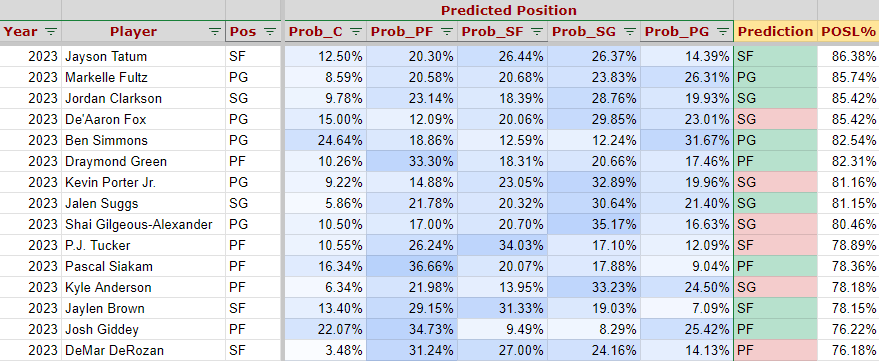
As a die-hard Celtics fan, it’s a coincidence that a Boston player came out on top. But you’ll have to trust that the numbers are genuine. In any case, Jayson Tatum had the highest POSL% score, with the most equally distributed probability across all five positions of any player in the league last season.
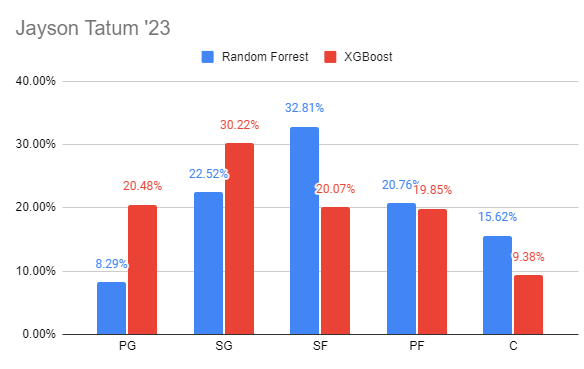 Jayson Tatum's position predictions for both models
The two models differed in how they viewed his position, with the Random Forrest model giving an edge towards SF, whereas the XGBoost model has a slight edge towards SG.
Is it a surprise Tatum is the most positionless player? Not according to our friend Brad Stevens, the Celtics head coach from earlier. In 2017, he had just drafted him 3rd overall, and said this about the rookie:
"Tatum will play wherever. He can handle the ball. He can move it. ... He's at least a wing because he can really handle the ball, too. And he can shoot it and do all those things. He's a very versatile player"
Let’s delve deeper into why Tatum was ranked most positionless. This is a screenshot from the Engine’s prediction explanation feature, which tells us how his particular stats affected the final prediction for each position.
 Prediction explanation for Jayson Tatums SF prediction by the Random Forest model
I’ll summarize how his particular play style and stats resulted in him having such a high POSL%.
As a modern player, he takes a lot of shots at the rim (0-3ft) or in the paint (3-10ft) which increases the probability for PF/C and decreases SG
Of course, he also takes a lot of shots from deep, increasing the probability for SF/SG and decreasing PF/C
He dunks at an above-average rate, which increases the probability for SF/PF/C and decreases PG/SG
Despite his size, he has an average offensive rebounding rate, increasing the probability for SF/SG and decreasing PG/C/PF
He's developed into a secondary playmaker with an above-average assist rate, increasing the probability for PG/SG and decreasing SF/PF
With a lot of defensive attention, he doesn’t get many corner 3-point attempts, decreasing probability for SF
Basically, he does a little bit of everything.
What about the player that the models got the most incorrect? The player whose listed position least matches how they actually play. That honor goes to Al Horford, who ranked 37th in POSL%.
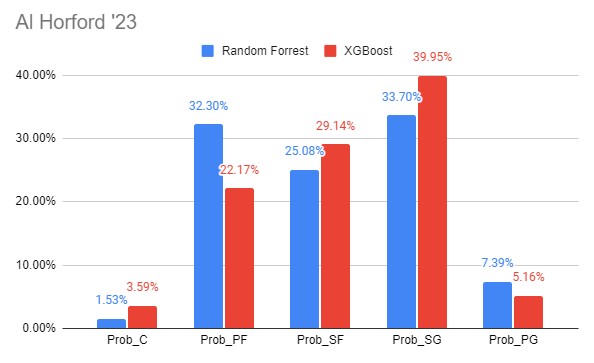 Al Horford's position predictions for both models
For someone listed as a C, neither model gives him much probability of playing there at all. Although big Al is listed at C, throughout the later years of his career, he has developed into a lethal 3pt spot-up shooter.
Wait a second…
Al Horford (37th in POSL%) was brought to the Celtics by Brad Stevens back in 2016. Around this time, Jayson Tatum (1st) and Jaylen Brown (13th) were drafted. Other players in those mid 2010s teams (that have since moved on) such as Kelly Olynk (16th) and Marcus Smart (31st) and Gordon Hayward (46th) also ranked highly.
It seems like Brad had a philosophy, and molded his players into positionless players. And it’s worked out well, the Celtics have remained perennial title challengers, having made the conference finals five times in the last seven seasons.
In 2015, he said this:
“The more guys that can play the more positions, the better”
This got me thinking, does having positionless players contribute to winning basketball games?
When looking at the players towards the top of the POSL% metric, three teams stand out in terms of having multiple players with high POSL%.
|
Boston Celtics 🍀 |
Orlando Magic 🪄 |
Oklahoma City Thunder 🌩️ |
|---|---|---|
|
Jayson Tatum (1) |
Markelle Fultz (2) |
Shai Gilgeous-Alexander (9) |
|
Jaylen Brown (13) |
Jalen Suggs (8) |
Josh Giddey (15) |
|
Marcus Smart* (31) |
Franz Wagner (24) |
Lugentz Dort (54) |
|
Al Horford (37) |
Cole Anthony (26) |
Jalen Williams (64) |
|
Derrick White (62) |
Paolo Banchero (34) |
Chet Holmgren* (ROOKIE) |
Other than having several high POSL% players, these teams have something else in common - they’re doing really well this season ('23-24). Let’s fast forward from last year to this season.
At least at the time of writing, these teams are top of the league, ranked 2nd, 3rd and 4th overall in winning percentage. It remains to be seen where they’ll end up by the end of the season (and more importantly in the playoffs), but maybe it’s true that playing a highly positionless style of basketball, with the right players, contributes to having success on the court.
Do you think I could be on to something here? Would you like to learn more about how I did this with ML using the Engine? ’d love to hear you’re thoughts and feedback.
The adoption of predictive analytics in the insurance industry is spearheading rapid evolution, leading to improved efficiency, and streamlined...
Manufacturing companies have embraced “smart manufacturing” and are adopting predictive analytics to maximize efficiency and save on costs.
Banks are adopting predictive analytics to gain an advantage, using it to predict customer behavior, forecast market trends, and assess risk...